Know the number before month end
A multi-market retail network was running on point-of-sale exports, spreadsheets, email attachments and half a dozen portals, none of which reconciled to each other. Sales sat in one export, inventory in another, labour in a third — and the same joins were rebuilt by hand every week.
At a glance
- Sector
- Wireless retail
- Scale
- Multi-market network
- Built
- Operations + sales dashboards
- Feeds
- Automated, hourly to monthly
A multi-market wireless retail network. Published anonymously — client names and figures are only shared with written permission.
What wasn't working
- Month-to-date numbers landed after the month was effectively decided
- No shared key between systems, so joining data was manual and repetitive
- Exceptions surfaced in review calls rather than reaching an owner
- Access was all-or-nothing, making data sharing a risk conversation
- Slow-moving stock was only obvious once it was already dead capital
- Commission disputes, because nobody fully trusted the underlying figures
The system we built and run
Built one data model
Sales, inventory, operations events, labour and finance were linked through shared business keys — site, market, person, product, period — so both dashboards resolve against identical records.
Automated the feeds, then policed them
Data arrives on a schedule through APIs, secure drops and managed uploads. Required columns and key values are validated first; failed rows are reported rather than loaded, and loaders upsert on a natural key so a replayed file can't duplicate anything.
Split operations from performance
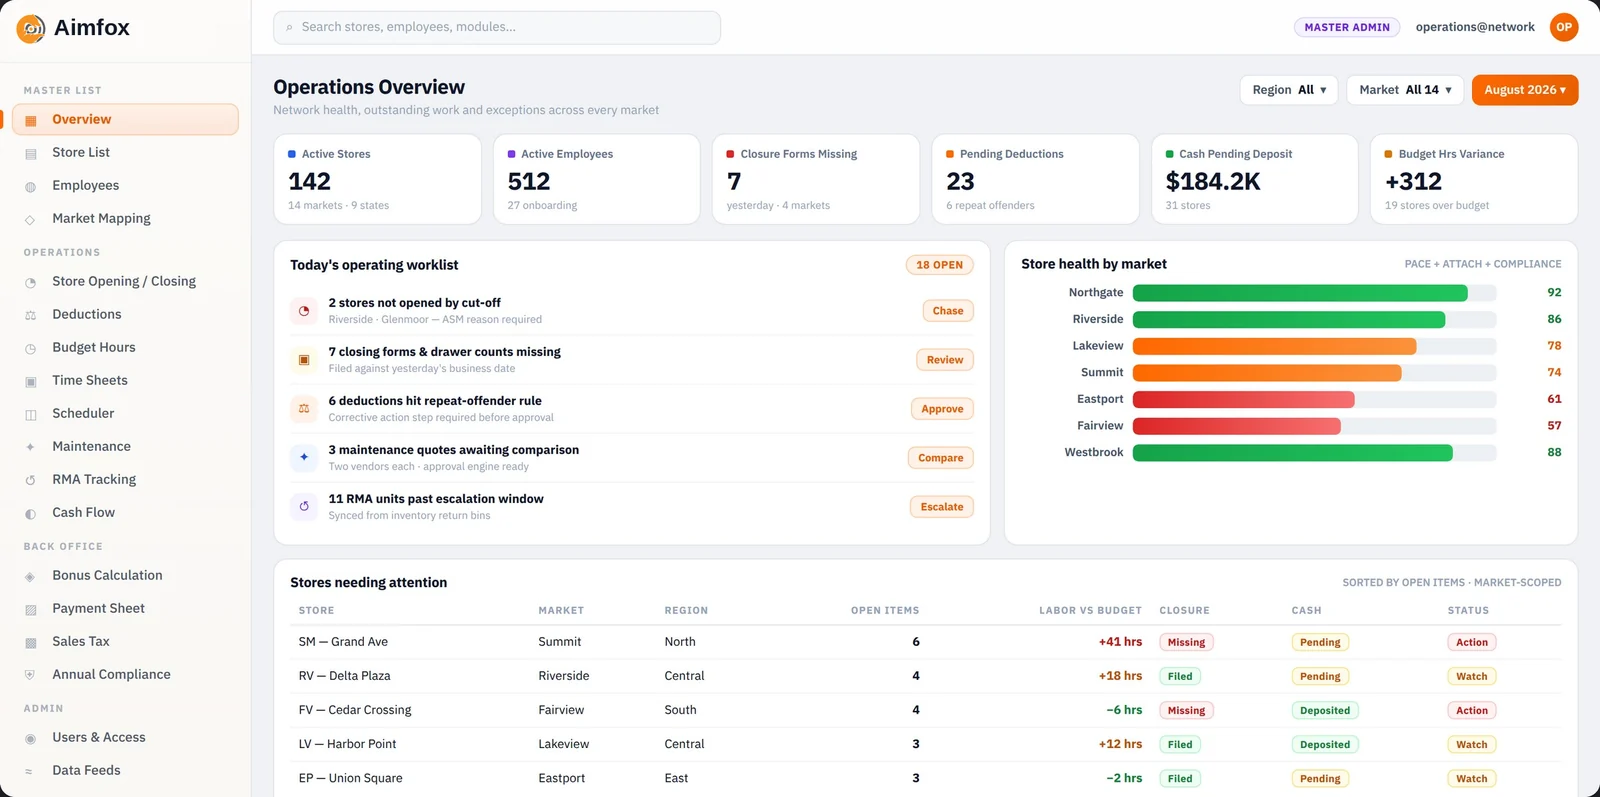
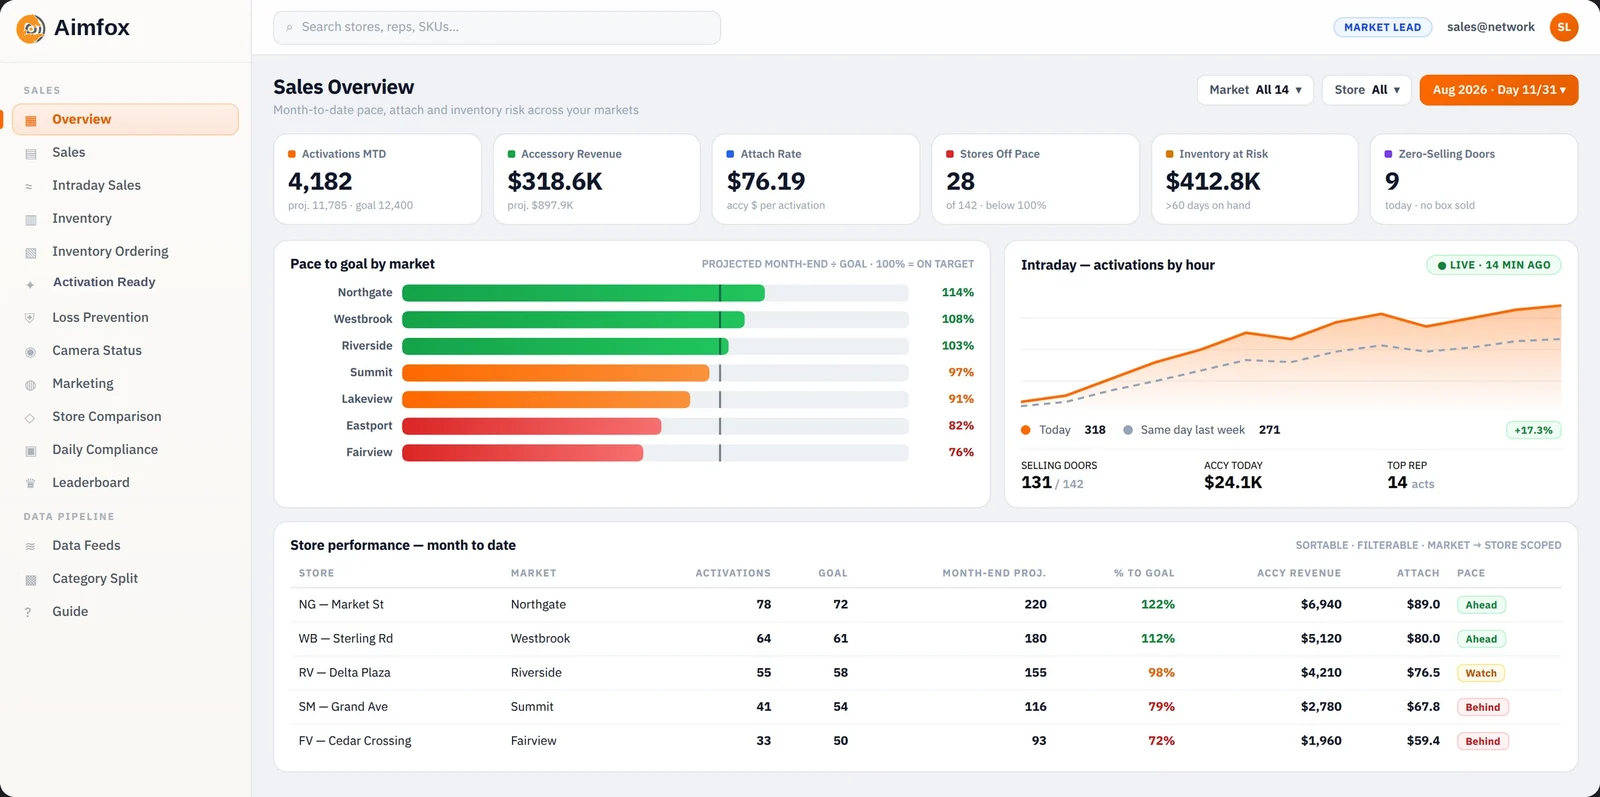
An operations dashboard runs master data, readiness, compliance, labour and the back office. A performance dashboard runs pace to goal, intraday movement, inventory ageing and field execution. One login, one permission model.
Made pace the headline, not totals
Projected month-end divided by goal, with the gap in units and dollars — so 'behind' is a number with days left to act on rather than an opinion after close.
Put risk beside the revenue
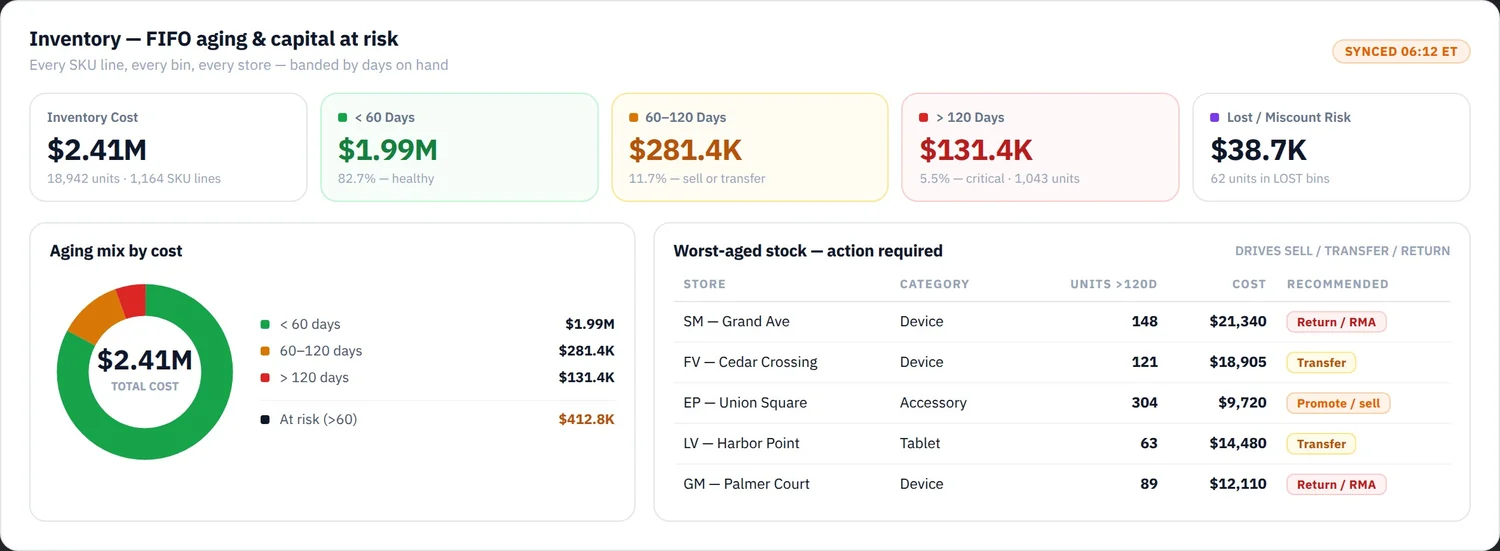
FIFO ageing bands, lost-unit ledgers and count-scan compliance sit in the same frame as the sales number they affect, so slow stock is answerable long before it's written off.
Scoped access in the data layer
Per-page access keys and site scope enforced in the database, so a market lead sees their markets and ownership sees the network — same screens, different slice.
The screens people actually open
Screenshots of the delivered interface, populated with demonstration data. We never publish a live client tenant.
The difference it made
Described as capability rather than invented percentages — we publish client metrics only when the client has agreed to them.
Shortfalls are visible while they're still fixable
Pace to goal and intraday movement mean a store behind target is identified during the month, not explained after it.
The weekly manual rebuild disappeared
Joins that were reconstructed by hand every week now run as validated automated feeds.
Exceptions have owners
Late openings, missing closures, zero-selling sites and ageing stock route to a named person with a next action instead of waiting for a review call.
Commission conversations changed
Incentives calculate against reconciled data and publish as per-person statements, so discussion moved from whether the number is right to what to do about it.
What it runs on
- Operations dashboard
- Sales performance dashboard
- Automated data pipeline
- Role-based access control
- Audit logging
The foundations are the same across every build — see how the platform works.
Leave the accounting to us
Your first month is free, onboarding takes as little as 24 hours, and rates start at $10/hour. No lock-in.