Every unit's stage, visible at a glance
A US multifamily operator was running leasing out of spreadsheets and shared inboxes. Units, applications, leases, insurance and tax records each lived in a different file, and the only way to know where a unit sat in the leasing process was to ask the person handling it.
At a glance
- Sector
- Multifamily rental
- Built
- Operations dashboard
- Pipeline
- Vacant → active lease
- Data
- One connected backend
A US multifamily property manager. Published anonymously — client names and figures are only shared with written permission.
What wasn't working
- No single view of which units were vacant, listed, showing or leased
- Vacancy going unnoticed for days because nothing flagged a newly empty unit
- Applications tracked by email, so status depended on who you asked
- Leases rekeyed by hand from application data, with the errors that invites
- Lease expiries discovered late, leaving no time for renewal conversations
- No record of who changed what, or when
The system we built and run
Mapped the leasing pipeline
We defined the stages a unit actually moves through — vacant, listed, showing, application, verification, lease, signed, paid, keys, active — and made each one a tracked state rather than a status someone remembers.
Built the operations dashboard
Sixteen linked modules covering units, vacancies, showings, applications, leases, properties, insurance, property tax and analytics, all reading from one connected backend rather than separate files.
Made exceptions surface themselves
Units vacant beyond a set threshold raise an alert; leases entering their final 90, 60 and 30 days are colour-coded for renewal outreach. Problems arrive on a worklist instead of in a meeting.
Removed the rekeying
Approved applications generate the lease directly from their own data against the client's template, so tenant details are entered once.
Added an audit trail
Every action is logged with a timestamp and an actor, giving a complete history for compliance and for settling 'who changed this' questions.
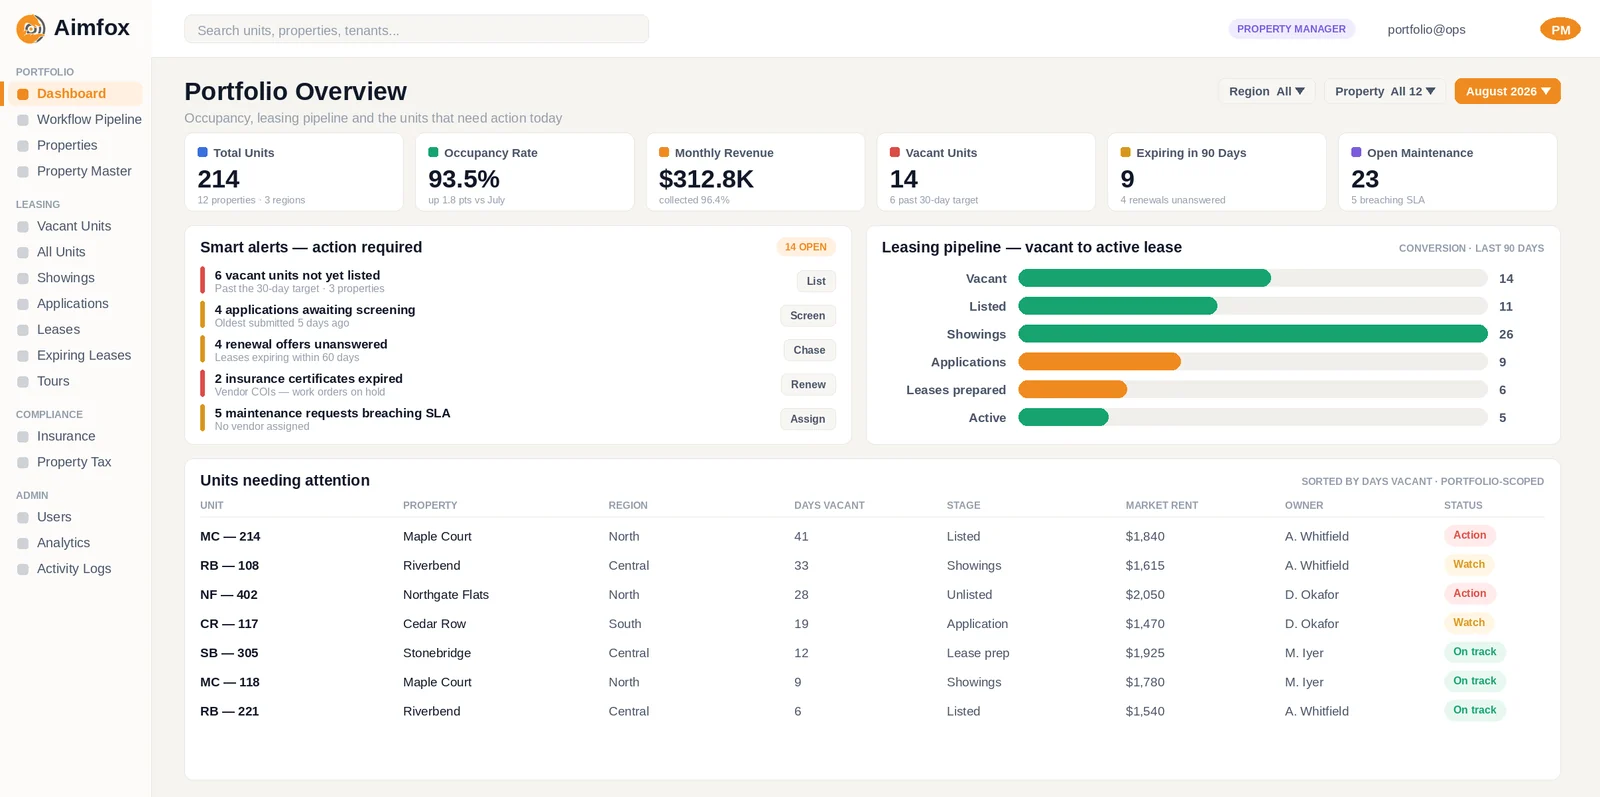
The screens people actually open
Screenshots of the delivered interface, populated with demonstration data. We never publish a live client tenant.
The difference it made
Described as capability rather than invented percentages — we publish client metrics only when the client has agreed to them.
Leasing status is now a screen, not a question
Anyone with access can see where every unit sits in the pipeline without asking a colleague or opening four spreadsheets.
Vacancy is caught the same day
Newly vacant units raise an alert rather than waiting to be noticed, which is where the recoverable rent actually is.
Renewals start early
Expiring leases surface up to 90 days out, so renewal conversations happen before a tenant has started looking elsewhere.
Reporting stopped being a rebuild
Occupancy, revenue and conversion reporting comes out of the same records the team works in, instead of being reassembled each month.
What it runs on
- Operations dashboard
- Connected data backend
- Analytics & charting
- PDF / CSV export
- Activity logging
The foundations are the same across every build — see how the platform works.
Leave the accounting to us
Your first month is free, onboarding takes as little as 24 hours, and rates start at $10/hour. No lock-in.