The Wireless Retail Dashboard, Screen by Screen
A walkthrough of the Retail Sales and Retail Operations dashboards we build for phone-store chains — activations pace, attach rate, store P&L, commission reconciliation, payroll, sales tax and feed health — using the Kestrel Mobile demo workspace.
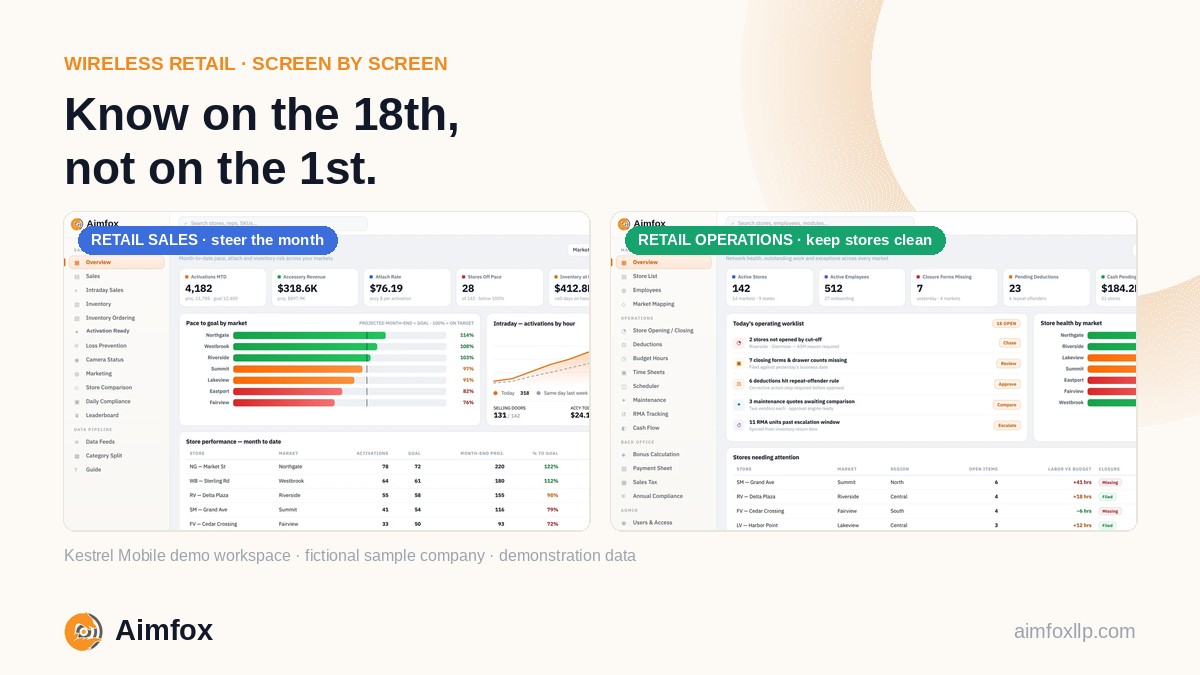
Wireless retail is a pace business. A phone-store chain does not find out on the first of next month whether it hit goal; it needs to know on the 18th, while there are still selling days left to close the gap.
That single requirement shapes everything in the wireless retail dashboard we build for multi-store operators: a Retail Sales dashboard for the people who steer the month, and a Retail Operations dashboard for the people who keep the stores compliant, staffed, paid and reconciled. Both read from one database with one permission model, so a store manager and an owner argue about the decision, never about the figure.
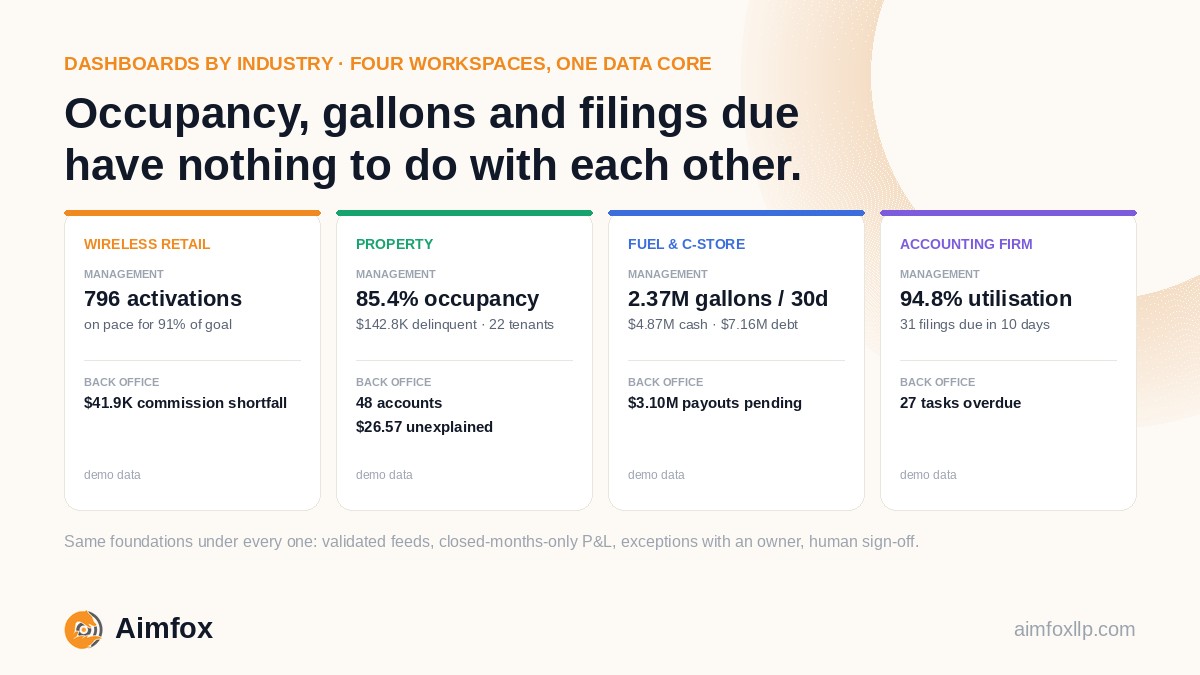
This is the detailed companion to our dashboards-by-industry overview. It walks through the screens using the Kestrel Mobile workspace in the live demo.
Kestrel Mobile is a fictional sample company — 30 stores across five markets. Every figure in this post is demonstration data from the demo workspace, not a client screen. We never publish live client numbers.
Two dashboards, two audiences
The Retail Sales dashboard is the management view. Owners, market leads and district managers open it to see how the month is going and where to intervene.
The Retail Operations dashboard is the back-office view. Bookkeepers, admin staff, area managers and store staff open it to see what is wrong today and work the list.
The split matters because the two groups ask different questions. Management asks are we going to make it? The back office asks what is missing, late or unreconciled, and who owns it?
The Retail Sales dashboard: the screens that steer the month
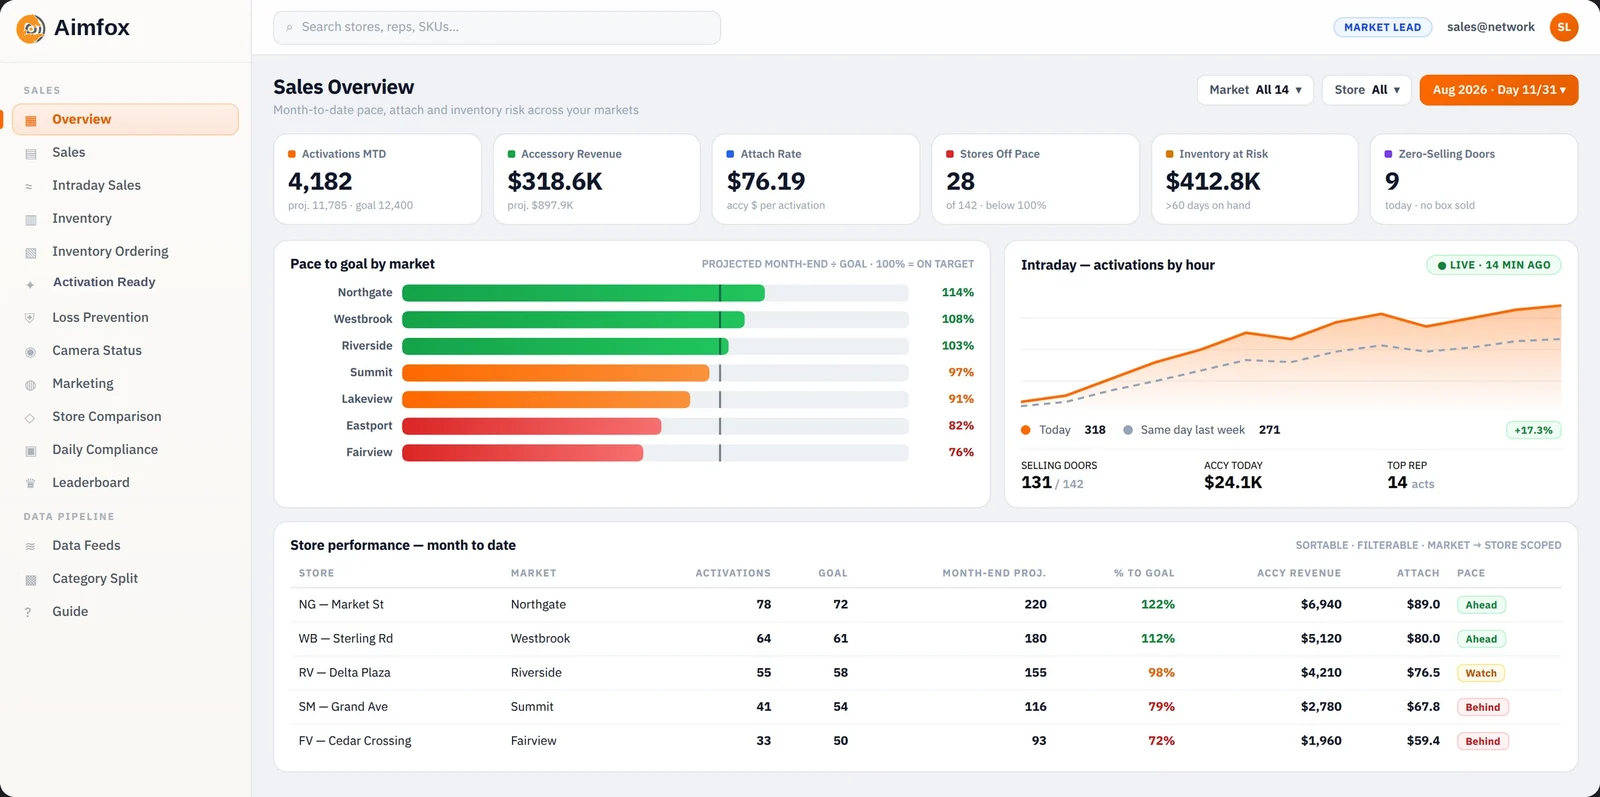
Activations vs goal, by market, store and rep
The home screen. Month-to-date activations sit against goal at every level of the hierarchy, with upgrades, new lines and accessory revenue broken out.
In the demo, Kestrel Mobile opens on 796 activations this month, on pace for 91% of goal, with selling days still left and its markets split either side of target. The owner reads the colour, the market lead reads the store row, and the store manager reads the rep row.
Pace to goal
Pace is the projected month-end result: activations so far divided by selling days elapsed, multiplied by selling days in the month, weighted for weekends and the end-of-month lift the chain historically sees.
In the demo, the Riverside store is pacing to 108% of goal; Eastgate is pacing to 81%. A good reading is pace at or above 100% with the gap narrowing day by day. A bad one is a store whose pace has been falling for a week — because the fix, whether staffing, traffic or a rep who has gone quiet, is still affordable on the 18th and is not on the 30th.
Attach rate and accessory revenue
Accessories and features attached per activation, by store and rep. Attach rate is where margin lives in a phone store, and it is also the earliest sign that a rep is chasing activation count at the expense of the basket.
The demo shows a network attach rate of 1.9 items per activation with one store at 1.2 — which is the row a market lead calls.
Intraday sales and zero-selling stores
The POS feed updates through the day, so the screen shows sales by hour and flags any store that has been open for a set number of hours with no transaction.
A zero-selling store at 2 p.m. is usually a POS outage, a staffing gap or an unopened store — all cheaper to find at 2 p.m. than at month-end.
Store and market P&L, closed months only
Per-store and consolidated P&L built from reconciled data: commission revenue at the received figure, inventory at FIFO cost, payroll and rent allocated by store.
A month appears here only once its reconciliations are signed off. That is why this screen lags the activation board by one statement cycle, and why it is the one the owner trusts for decisions about opening, closing or re-staffing a location.
Inventory ageing and purchase orders
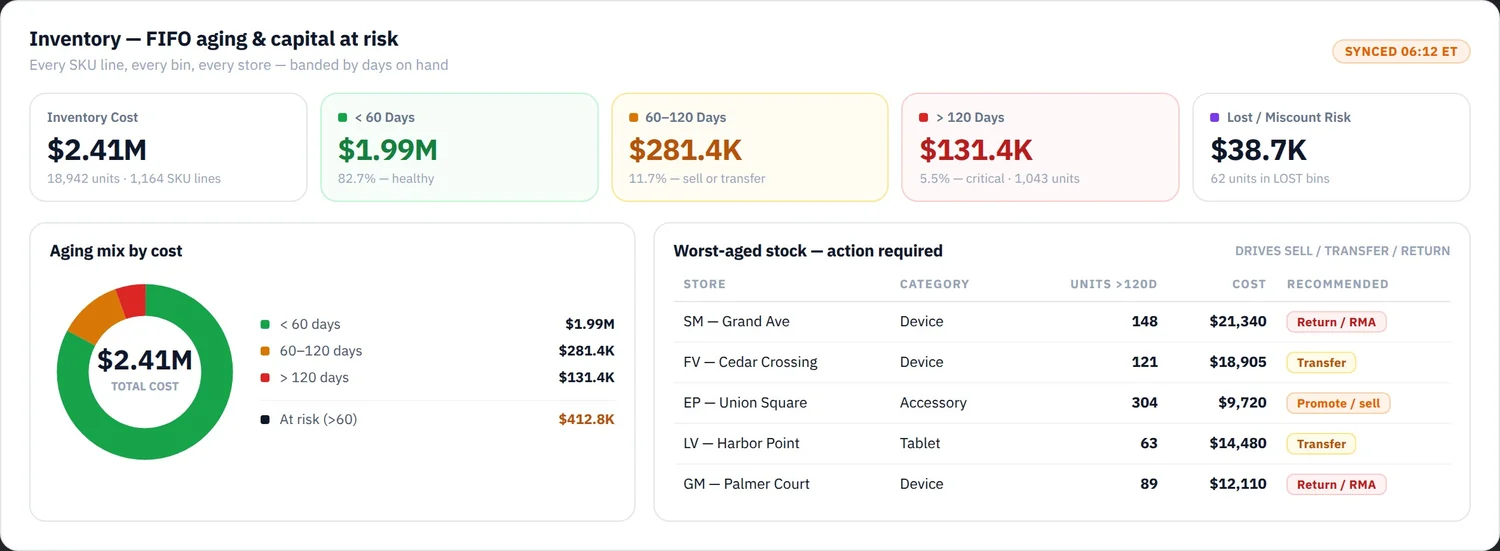
Device inventory is aged in FIFO bands — under 60, 60–120 and over 120 days — with the dollar value in each band shown as capital at risk. Purchase orders are tracked as ordered versus received, so over-ordering surfaces before the stock ages.
In the demo, $84,000 of Kestrel Mobile's stock sits in the over-120 band, concentrated in two stores. That is the kind of dead capital that quietly erodes a good sales month.
The Retail Operations dashboard: the screens that keep the stores clean
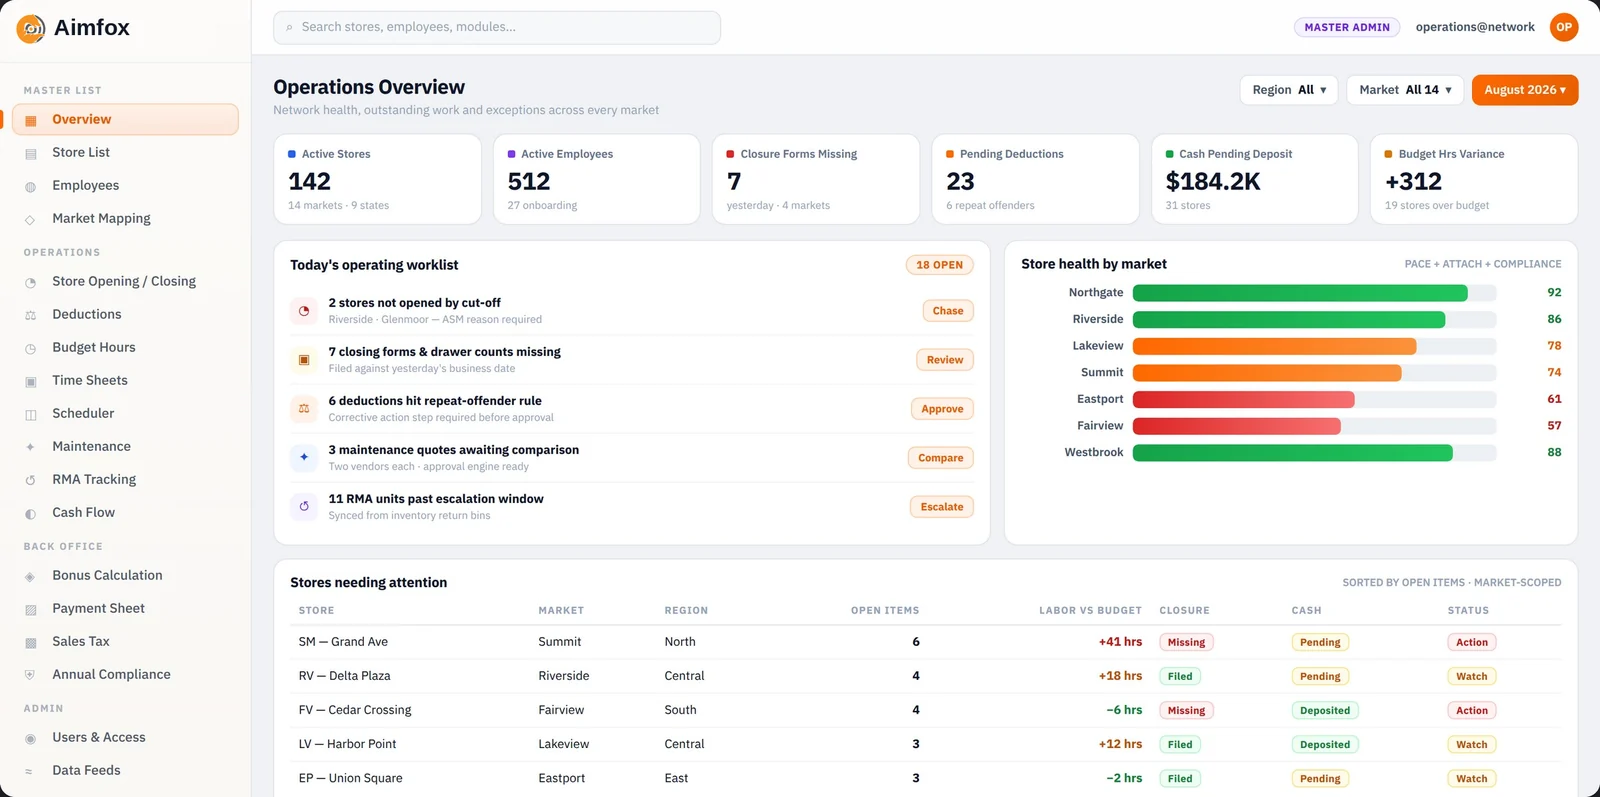
Exception worklist and store health by market
The operations home screen opens on what is wrong today: missing daily closure forms, pending deductions, unreviewed incidents, zero-activity sites and out-of-range variances — each assigned to an owner with an age.
Store health rolls these up by market as a simple status, so an area manager sees in one glance which stores need a call before lunch. Items are cleared only by fixing the underlying record, never by dismissing the flag.
Scheduler and labour
Shifts by store against forecast traffic, with scheduled hours compared to actual hours and to sales per labour hour. The screen flags stores scheduled below minimum coverage, overtime building before it is earned, and the quiet connection between an understaffed Saturday and a store that is pacing behind.
Payroll, commission reconciliation and bonus
Three linked screens.
Commission reconciliation compares expected carrier commission from reconciled POS activations to what the carrier file actually paid, per store and month, and routes unmatched lines and short-pays to a human queue.
Payroll takes hours from the scheduler and reconciled commission — never the POS estimate — and prepares the run. This is the piece most chains get wrong, and the piece we run as a service for operators who would rather not.
Bonus applies the chain's eligibility rules — attach-rate thresholds, chargeback limits — and drafts per-person statements. Every statement is reviewed before it is published, which is what stops payout disputes from reaching the store floor.
Sales tax
Taxable sales by jurisdiction, tax collected per the POS, and the remittance calendar with due dates and amounts, reconciled to the general ledger each month.
Multi-state and multi-county chains get a filing worklist so a return is never late because nobody knew it was due — and a sales-by-state view that shows when a store is approaching an economic nexus threshold in a state it is not yet registered in.
Compliance and daily closing verification
Daily closure forms, cash deposits matched to bank, loss-prevention flags and the lost-device ledger, plus the chain's own compliance checklist by store.
The demo's exception worklist shows stores with closure forms missing for yesterday and a deposit variance over tolerance — both back-office items the owner never needs to see unless they go stale.
Feed health
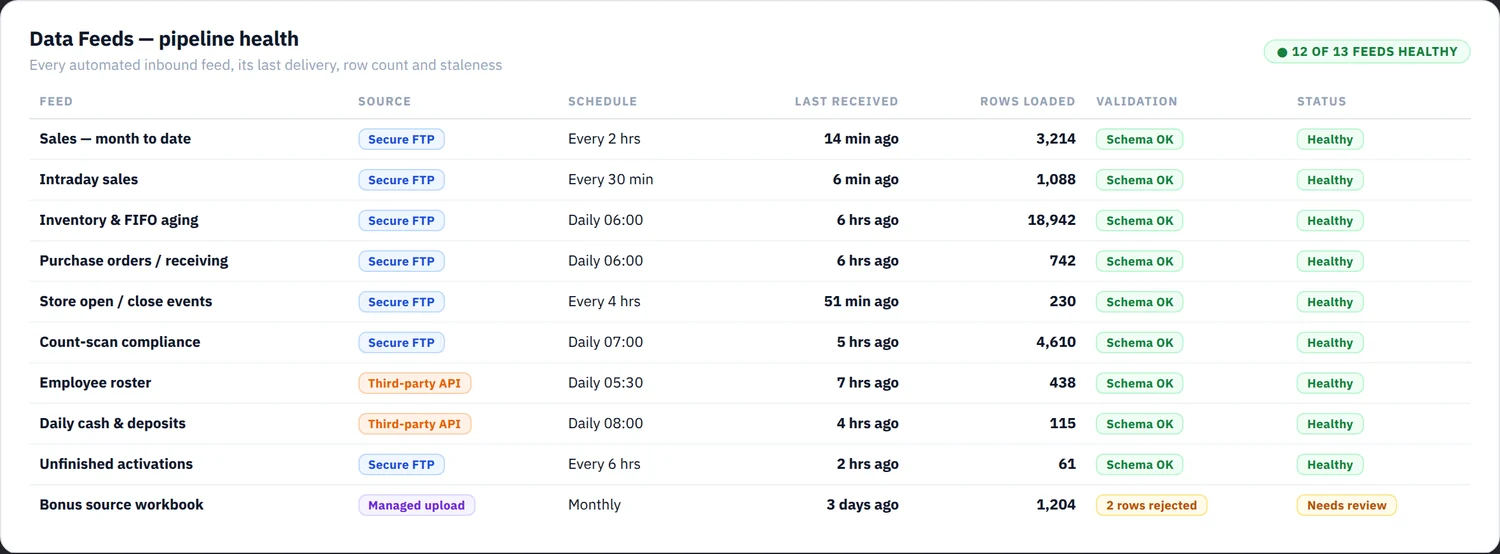
Behind every screen above is a data pipeline: connect, validate, unify, compute, activate. Feed health shows when each POS, carrier, payroll and bank feed last loaded, which rows were rejected and why — so a wrong number can always be traced to a missing or malformed file rather than guessed at.
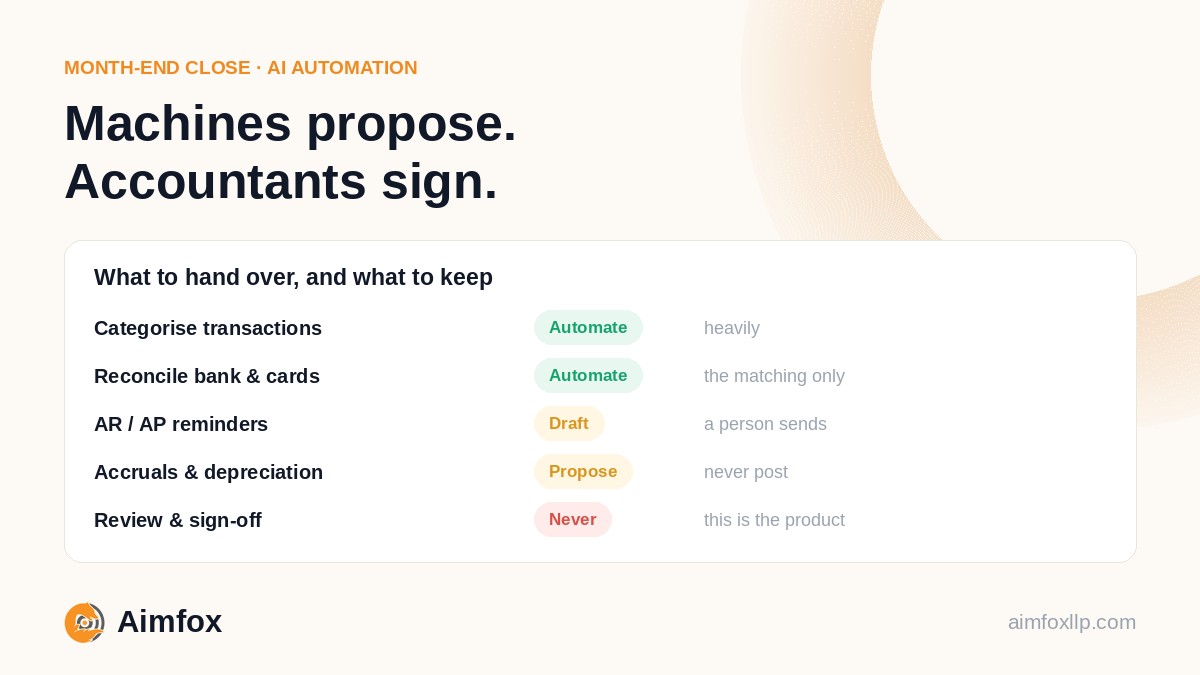
Rules where rules fit, patterns where they help, and a person signs off
Goal pacing, FIFO ageing, tax calculation and commission matching are rules, and they are auditable.
Pattern detection is used where rules run out: projecting month-end from the chain's own seasonality, scoring near-matches on carrier files, and flagging a store whose variance is unusual for its history.
Nothing is published on model output alone. A named reviewer signs off before a commission statement, a payroll run, a tax filing or a month-end P&L is released — the stance that runs across the whole Aimfox platform, and the reason we wrote about what to automate and what to keep.
See it with your own stores
Our phone-store and wireless-retail back office loads your POS, carrier, payroll and bank feeds, keeps every screen above reconciled, and hands you the number before month-end. The multi-market retail case study describes a build on exactly this structure.
The live demo opens the full Kestrel Mobile workspace — both dashboards — with nothing more than a work email.
Know the number before month-end
Book a 30-minute call and we will map your stores, carriers and systems onto these screens, show you what the first month looks like, and quote a fixed monthly price. First month free, no lock-in.
Retail & fuel back office · Dashboards, ERP & automation · All industries
Screens shown are the platform running on demonstration data. Kestrel Mobile, its stores and every figure are fictional.