Management and Back-Office Dashboards by Industry: Wireless Retail, Property, Fuel and Accounting Firms
What a management dashboard and a back-office dashboard should show for a wireless retail chain, a property manager, a gas station group and an accounting firm — with the actual screens from our live demo.
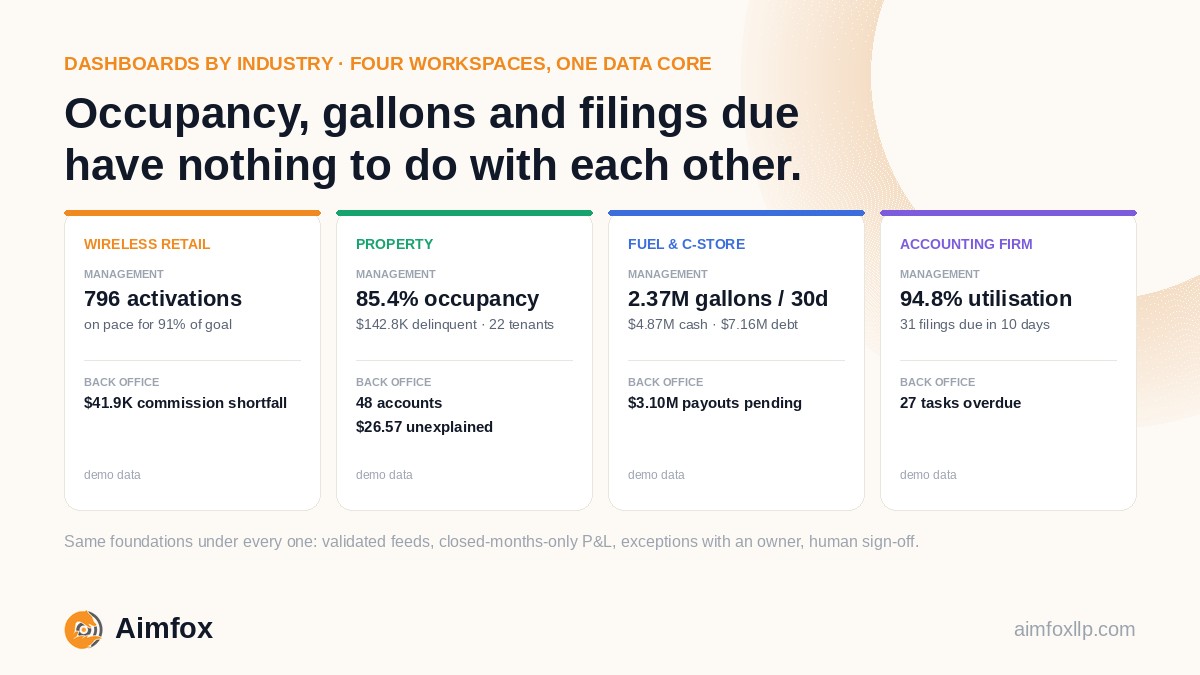
Most dashboard products are generic: revenue, expenses, cash, a few charts. They look fine on day one and get ignored by week two, because the numbers that run a wireless store — activations per day, carrier commission — are not the numbers that run a property portfolio, a fuel site or an accounting firm. Occupancy, gallons and filings due have nothing to do with each other.
That is why we do not build one management dashboard and hand it to everyone. We build a separate workspace per industry, each with two views: a management view for the people making the calls, and a back-office view for the people doing the work. Both read the same governed data core, so the owner's number and the bookkeeper's number are always the same number.
Below are the four industries in our live demo, with what the actual screens show.
All figures in this post are demonstration data from the live demo, on fictional sample companies. We never publish live client screens or client numbers.
Wireless retail chains
Sample company: Kestrel Mobile — 30 stores across five markets.
What management sees
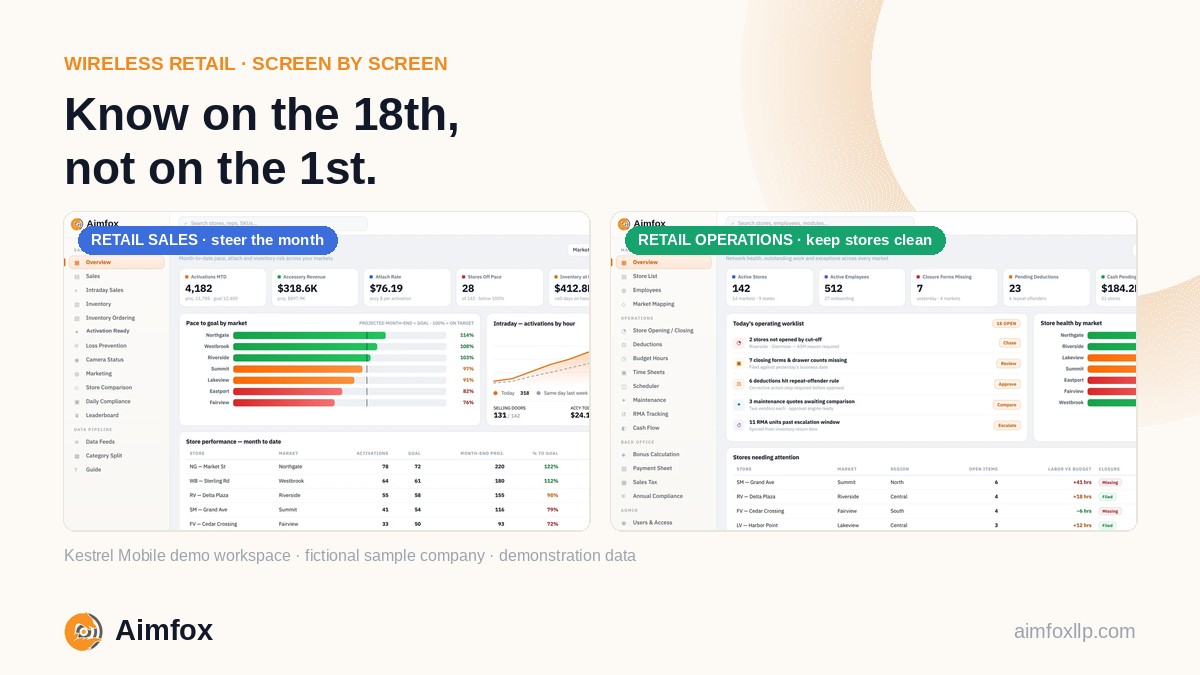
The overview opens on pace, not totals: 796 activations this month, on pace for 91% of goal, with last month closed at 95.6%.
Underneath sit the stores furthest behind target and a closed-months-only income statement by store, market and chain — six months of revenue at $6.13M, net margin 17.4%, payroll at 43.2% of revenue, and 37 store-months at a loss. A retail operations dashboard earns its keep when a market lead can see which three stores to call before lunch.
What the back office runs
Commission reconciliation is the screen that pays for itself: what the carrier should have paid each store against what it did pay. In the demo, $3.07M expected against $3.03M received — a $41,858 shortfall, 26 short-paid store-months and five open disputes, each routed to a named owner.
Around it sit the scheduler, timesheets and budget hours, the payroll run, bonus statements, sales-tax filings, journal vouchers and a compliance calendar. The multi-market retail case study describes how this one was built. For every screen in both views, see the wireless retail dashboard, screen by screen.
Property managers
Sample company: Cedar & Stone Properties — 151 units across 12 properties and six owner entities.
What management sees
A property management dashboard is about money owed and leases expiring.
The demo opens on 85.4% occupancy (129 of 151 units), $455K of rent due this month with 81.2% collected, a delinquent balance of $142,838 across 22 tenants, 11 open work orders and 23 leases ending within 90 days. The largest unpaid balances are listed with a next step — reminder call, or notice to pay or quit — and owner statements are generated per entity rather than rebuilt in a spreadsheet each month.
What the back office runs
Every bank and card account, for every LLC, with statement balance against book balance: 48 accounts in the demo, an unexplained difference of $26.57, two flagged issues, each with a due date. Alongside it, the bank feed, intercompany transfers and a quarterly review queue.
There is also an assistant that answers plain-English questions — who is behind on rent, which leases end next quarter — from the same records as every other screen. The property management case study covers the leasing pipeline behind it.
Gas station and convenience-store groups
Sample company: Ridgeway Fuel Partners — 22 sites held across 12 companies and 14 partners.
What management sees
Fuel portfolios are balance-sheet businesses, so a gas station management dashboard leads with cash and debt: $4.87M in the banks, $7.16M of debt owed, $2.86M of card payouts pending, 2.37 million gallons in the last 30 days, and net income by group.
Anything waiting on a decision sits in a two-step approval queue — department head, then owner — a $66,000 dispenser repair, an $85,700 draw on a line of credit. Operator leases up for renewal show the end date and base rent, and each partner sees their own sites through a partner portal.
What the back office runs
Card sales settle to the landlord, so twice a month each operator is reimbursed less the rent set off against it. The demo tracks $31.5M of card sales, $1.17M of rent set-off and $3.10M of pending payouts, with three held for review.
Next to it: a loan department for every note, invoice and payment, an expense queue, and a sync to QuickBooks so the books and the dashboard agree. This is the retail and fuel back-office work, with a screen on top of it.
Accounting and professional-services firms
Sample company: Lumen Advisory LLP — a services firm running client compliance work.
What management sees
For a services firm the number is capacity. Who is in today (23, with the attendance split shown), 19 tasks due this week, 27 overdue, 31 client filings due within 10 days, 10 approvals waiting, and billable utilisation at 94.8%.
Filings are listed soonest-first with a status — pending, data received, in progress, under review — so a partner can see which deadlines are at risk before the client does.
What the team runs
Each person gets their own tasks, timesheet and attendance. The firm gets a compliance calendar by client, an approvals queue, client logins and a kudos board.
It is the same pattern our own back-office team uses when we work white-label for CPA firms — and the capacity view is the one that matters most going into busy season.
What all four share
The screens differ. The foundations do not.
Data arrives on a schedule and is validated at the door — a file that fails its contract is rejected and reported, never silently loaded. The P&L shows closed months only; the current month joins once it is reconciled. Exceptions are detected automatically and routed to a person, projections are labelled as projections, and nothing reaches a statement, a filing or a payment on model output alone — a human signs off first. Access is granted per page and per site, enforced in the data layer, with an audit log.
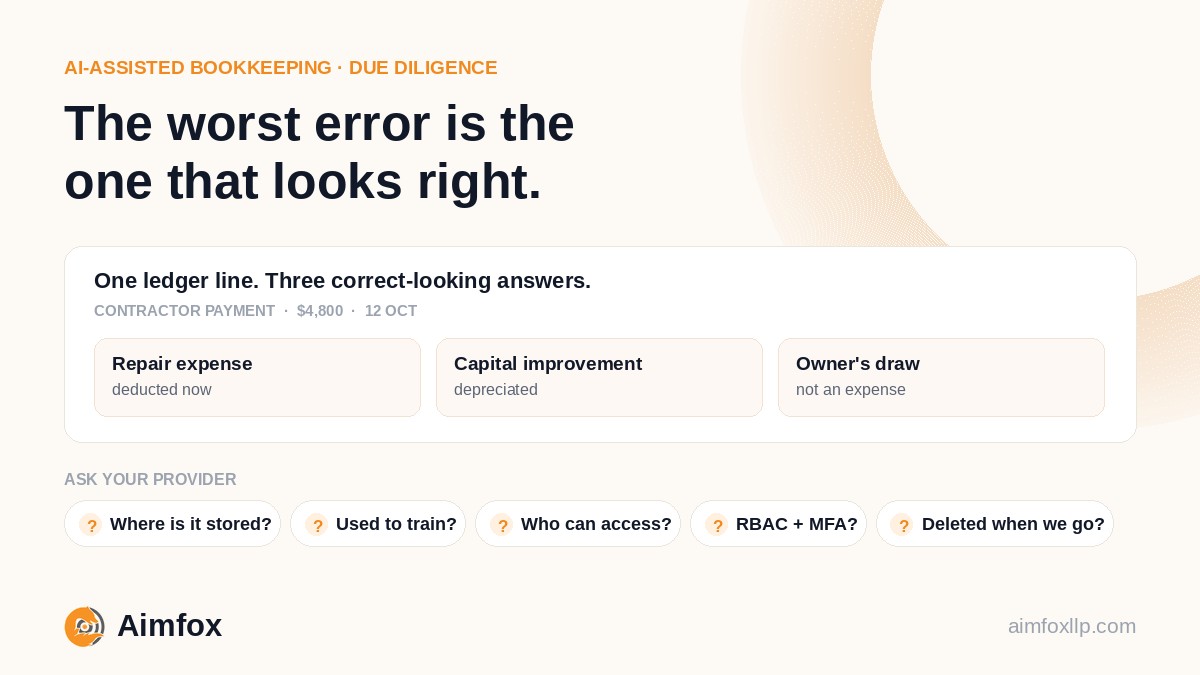
Underneath all of it are clean books. A dashboard built on an unreconciled ledger is just a faster way to look at the wrong number — which is why we treat the month-end close and the dashboard as one job.
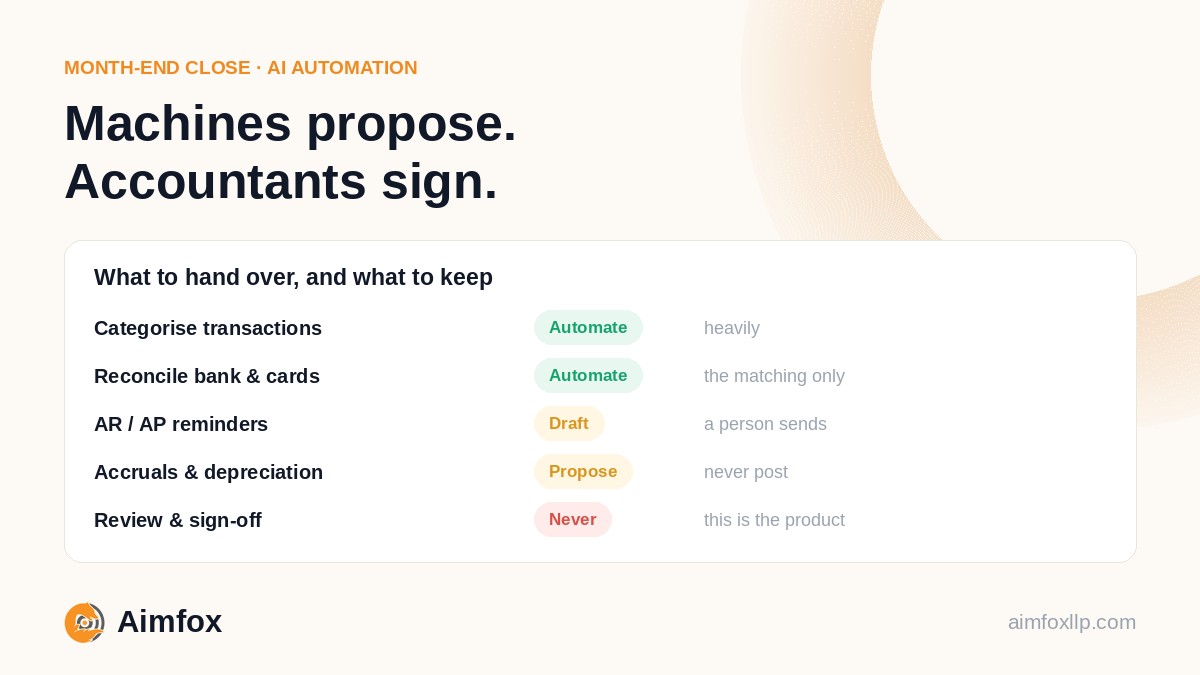
We have written separately about which close tasks to automate and what to ask before trusting a tool with your books.
Which numbers belong on yours?
If your business is one of the four above, the demo is a working starting point.
If it is not — construction, healthcare, restaurants, e-commerce, logistics, or the other sectors on our industries page — the method is the same. Name the five or six numbers your industry actually runs on. Define each one the same way for every site. List the back-office queues that need an owner and a due date. Keep unclosed months out of the P&L. Then build the two views on one source.
Click through all four workspaces on sample data in the live demo, then book a free consultation. We will show you what a management and back-office dashboard for your industry would look like — books included.
How the platform works · Case studies · Dashboards, ERP & automation
Figures and company names in this post are demonstration data from the Aimfox live demo. Kestrel Mobile, Cedar & Stone Properties, Ridgeway Fuel Partners and Lumen Advisory LLP are fictional.