The Gas Station Management Dashboard, Screen by Screen
Every screen of the fuel-station portfolio workspace we build and run — ownership map, P&L and break-even by company, loans in three directions, operator card-sales settlements with rent set-off, two-step approvals and QuickBooks sync — using the Ridgeway Fuel Partners demo group.
A fuel group is rarely one business. It is four, sharing a ledger: fuel margin, real estate, lending, and a partnership that has to be paid out fairly every quarter. Each one settles on a different calendar, and the first time most groups see them side by side is month-end.
That is late. NACS put US convenience-store fuel sales at $476.3 billion for 2025, with a record $21.3 billion going to card fees, and one retailer-data analysis had the typical station's margin moving about seven cents a gallon in June 2026 alone. On a group pumping 2.6 million gallons a month, a single cent is $26,000. On margins that thin and that mobile, a monthly review finds problems after the money has gone.
This is our third workspace tour, after wireless retail and property management. It walks the gas station workspace screen by screen: what each one shows, what a good or bad reading looks like, and who does what about it.
Ridgeway Fuel Partners is a fictional sample company. Every figure below was read from the live demo in November 2026. It is demonstration data, not a client screen — we never publish live client numbers — and the sample dataset is refreshed from time to time, so what you see when you click through may differ slightly.
The sample group
Ridgeway holds 24 sites across Georgia and South Carolina through 12 companies, organised into four groups, with 14 partners between them. Each company is a real-estate holding that owns one or more branded sites and leases them to an operator.
That structure decides what the dashboard is for. Ridgeway's revenue is mostly rent — around $328,000 a month — with fuel margin of roughly $100,000 on top. The operator runs the store. Ridgeway owns the dirt, carries the debt, collects the card sales, and answers to its partners. The workspace is built around that reality, in 33 screens.
How the workspace is laid out
One database, two kinds of reader. Owners, partners and group leads want to know how the portfolio is doing and where the cash is. The back office — bookkeepers, admin staff, the people who run settlements and chase leases — keeps those numbers true.
Every screen carries the same three filters: group, company, site. Scope is enforced in the database, so a partner sees their companies and nothing else. Hiding a menu item is never the security model.
What owners and partners see
Portfolio overview
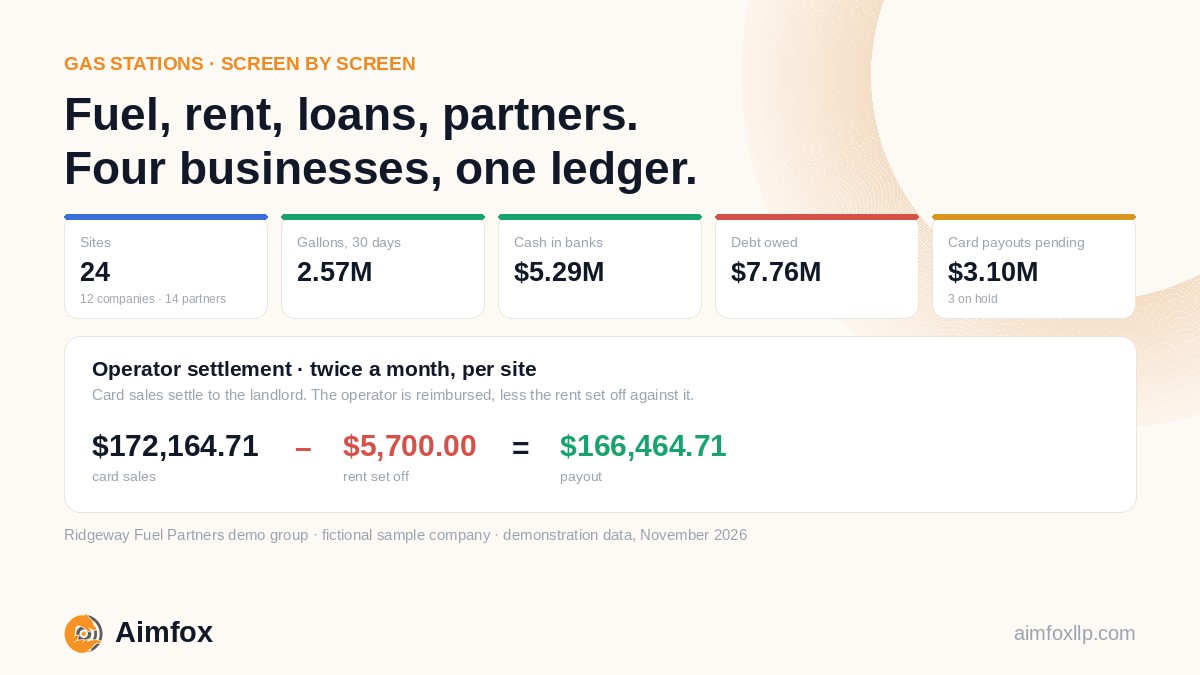
The opening screen answers five questions at once: 24 sites, 2.57 million gallons in the last 30 days, $5.29M cash in banks, $7.76M debt owed, and $3.10M of card payouts pending. Underneath: gallons per day for the last 90 days, net income this year by group, approvals waiting, and leases coming up for renewal.
Good is gallons tracking their own trend and cash comfortably ahead of the next round of payouts. Bad is a volume line that has been sliding for a fortnight while nobody was looking at anything but the monthly total.
Portfolio and ownership
The portfolio screen is the map: groups, the companies inside them, their sites, and the bank accounts each one holds. The ownership screen sits on top of it — each group's managing partner, each partner's percentage, down to the company and the sites behind it. Where a company's split differs from its group's, it says so.
This looks like administration. It is actually the foundation: every distribution, every partner statement and every scoped login is computed from this table, so it has to be right once rather than re-keyed every quarter.
Profit and loss, by company
Closed months only, accrual basis, straight from QuickBooks. Nine months to September shows $4.02M revenue, $1.10M net profit and a 27.2% net margin across the twelve companies, with rent income, fuel margin and other income as separate revenue lines and every expense line an accountant expects below them.
An open month is a guess, and the dashboard does not dress one up as a result. The reading to watch is not the group total — it is which company is carrying the others.
Break-even
This is the screen owners did not know they wanted. Break-even revenue for the portfolio is $304K a month — about $10,100 a day — against average revenue of $447K, a 32.1% margin of safety. Fixed costs run at $258K a month: property tax, insurance, professional fees, interest, depreciation.
The portfolio figure is comfortable. The table underneath is the useful part: companies ranked closest-to-the-line first, with months below break-even counted. In the demo, two of the twelve sit below it, and have for nine straight months. A blended margin of safety hides exactly that.
The loan department
Fuel groups lend and borrow more than people expect. This register holds all three directions — loans taken, loans given, and loans between the group's own companies — with principal, rate, maturity, monthly payment and what is outstanding.
In the demo: $7.76M owed by Ridgeway, $453K owed to it, $288,773 in monthly payments across sixteen facilities, and one past due. Loan invoices and payments each have their own screen, so an instalment is a record with a status rather than a line somebody remembers.
Good is every facility current and the register agreeing to the lender's statement. One past-due line of credit is an owner conversation that week, not at quarter-end.
The partner portal
What a partner sees when they sign in: the companies they hold a stake in, the sites behind those stakes, their share of net income for the year, every distribution paid, and what is proposed for the current quarter.
One demo partner holds 25.4% of a single company with two sites: $52,416 share of net income year to date, $20,769 distributed, $10,681 proposed for Q3. It is the same governed data the back office works from, so there is no second set of numbers to reconcile before the distribution goes out.
What the back office runs
Card-sales reimbursement, less rent set-off
This is the screen that makes operator-run sites workable, and the one most likely to go wrong in a spreadsheet.
Card sales at each site settle to the landlord. So twice a month, Ridgeway owes each operator that money — less the rent the operator owes Ridgeway. The screen builds one line per site per period: card sales, rent set off, any adjustment, the net payout, and its status.
Across the demo that is $31.5M of card sales, $1.17M of rent set off, $3.10M of payouts pending and three on hold. A single line looks like this: $172,164.71 of card sales, less $5,700.00 rent, pays out $166,464.71.
Good is a payout that ties to the processor deposit to the cent with no adjustment. An adjustment is not a problem — it is a question, and the screen makes sure somebody asks it. Bad is a reimbursement paid gross while the rent still shows as receivable, which means the group paid out money it was owed.
Leasing and rent
The leasing dashboard is the landlord's side at a glance: 88.9% of units leased, a $334K monthly rent roll, $160K collected so far this month, seven overdue invoices and eleven open work orders. Tenants, leases, accounting, maintenance and tickets each have their own screen behind it.
Leases up for renewal show the tenant, the site, the end date and the base rent. Because rent is collected by set-off against card sales rather than by invoice and cheque, an overdue rent line usually means the operator's card volume has fallen — which is a business question before it is a collections one.
Two-step approvals
Anything that commits money goes through two people: a department head, then an owner. The queue shows what is waiting, which company it belongs to, the amount and which step it is on.
Nine requests are open in the demo, among them a $66,000 pump dispenser repair at step one and an $85,700 draw on a line of credit. The value is less in catching fraud than in the ordinary errors a second pair of eyes catches: a duplicate invoice, a draw against the wrong facility, a repair quoted twice.
QuickBooks sync
Ridgeway keeps its ledgers in QuickBooks — one file per company, as most groups do. The platform does not replace them.
The sync screen lists all twelve connections with the last sync time, the account and class counts, and whether any need re-authorising, with a sync log behind it. The dashboard does the matching across companies; QuickBooks stays the book of record. If you are still on Desktop, year-end is the time to move.
Station data sync
Station sales are pulled from the fuel supplier's portal twice a day. This screen is the pull itself: when it ran, how many sites came through, how many rows, how long it took, and whether it succeeded.
Forty runs in the demo, 97.5% complete — and one marked Partial, where nineteen of twenty-three sites came through. That is the point of the screen. A feed that half-failed shows up as a row that says so, not as a quietly thinner chart on the overview.
Expenses, insurance and taxes
An expense queue for everything that is not a loan or a settlement, and a register for the insurance policies and property taxes that make up most of the fixed costs on the break-even screen.
What the dashboard does not do
It does not set pump prices, and it does not release a payment. It projects, matches, flags and routes.
Rules do the work where rules fit: settlement arithmetic, set-off, break-even, due dates. Pattern detection helps where a rule would be too blunt — an operator whose card volume dips whenever an instalment falls due. A person signs off before anything reaches a statement, a distribution, a filing or a payment. That stance runs across the whole platform, and it is why we wrote about what to automate and what to keep.
If you also run the stores
Ridgeway leases its sites out. Plenty of groups operate some of their own, and then there is a layer upstream of everything above: daily closing forms, pump totals against POS, over/short, lottery, and cash matched to the bank deposit. That routine is what our gas station back office runs, and it is where inside margin starts to matter — NACS has foodservice at 28.5% of in-store sales but 38.9% of in-store gross profit, so a site that sells fuel and little else is leaving most of its profit outside.
See it with your own sites in mind
Open the live demo and click through the Ridgeway workspace. It runs on sample data, so nothing you do changes anything.
Then book a 30-minute call. We will map your companies, operators, lenders and ledgers onto these screens and quote a fixed monthly price. First month free, no lock-in.
Gas station & convenience-store back office · Retail & fuel back office · Dashboards, ERP & automation · All industries
Screens described are the platform running on demonstration data, as read in November 2026. Ridgeway Fuel Partners, its companies, partners, operators and every figure are fictional. Industry figures are NACS data for 2025 and a June 2026 retailer-data analysis, as linked.